Reading a phase portrait
A phase portrait colours each point z of the plane by the value f(z) takes there. Once you can
decode the colouring, a single image tells you where the zeros and poles are, what order they have,
and how the function behaves between them.
Hue is phase
Every complex number has a modulus and a phase. The phase — arg(f(z)), normalised to [0, 2π) —
is mapped to hue, all the way round the colour wheel. So:
- A zero is a point every hue converges on, with the colours running counter-clockwise around it.
- A pole looks similar, but the colours run clockwise.
- The order is how many times the full colour wheel repeats as you walk once around the point. A double zero cycles the wheel twice.
That last one is why the sector count matters.
The legend is the identity map
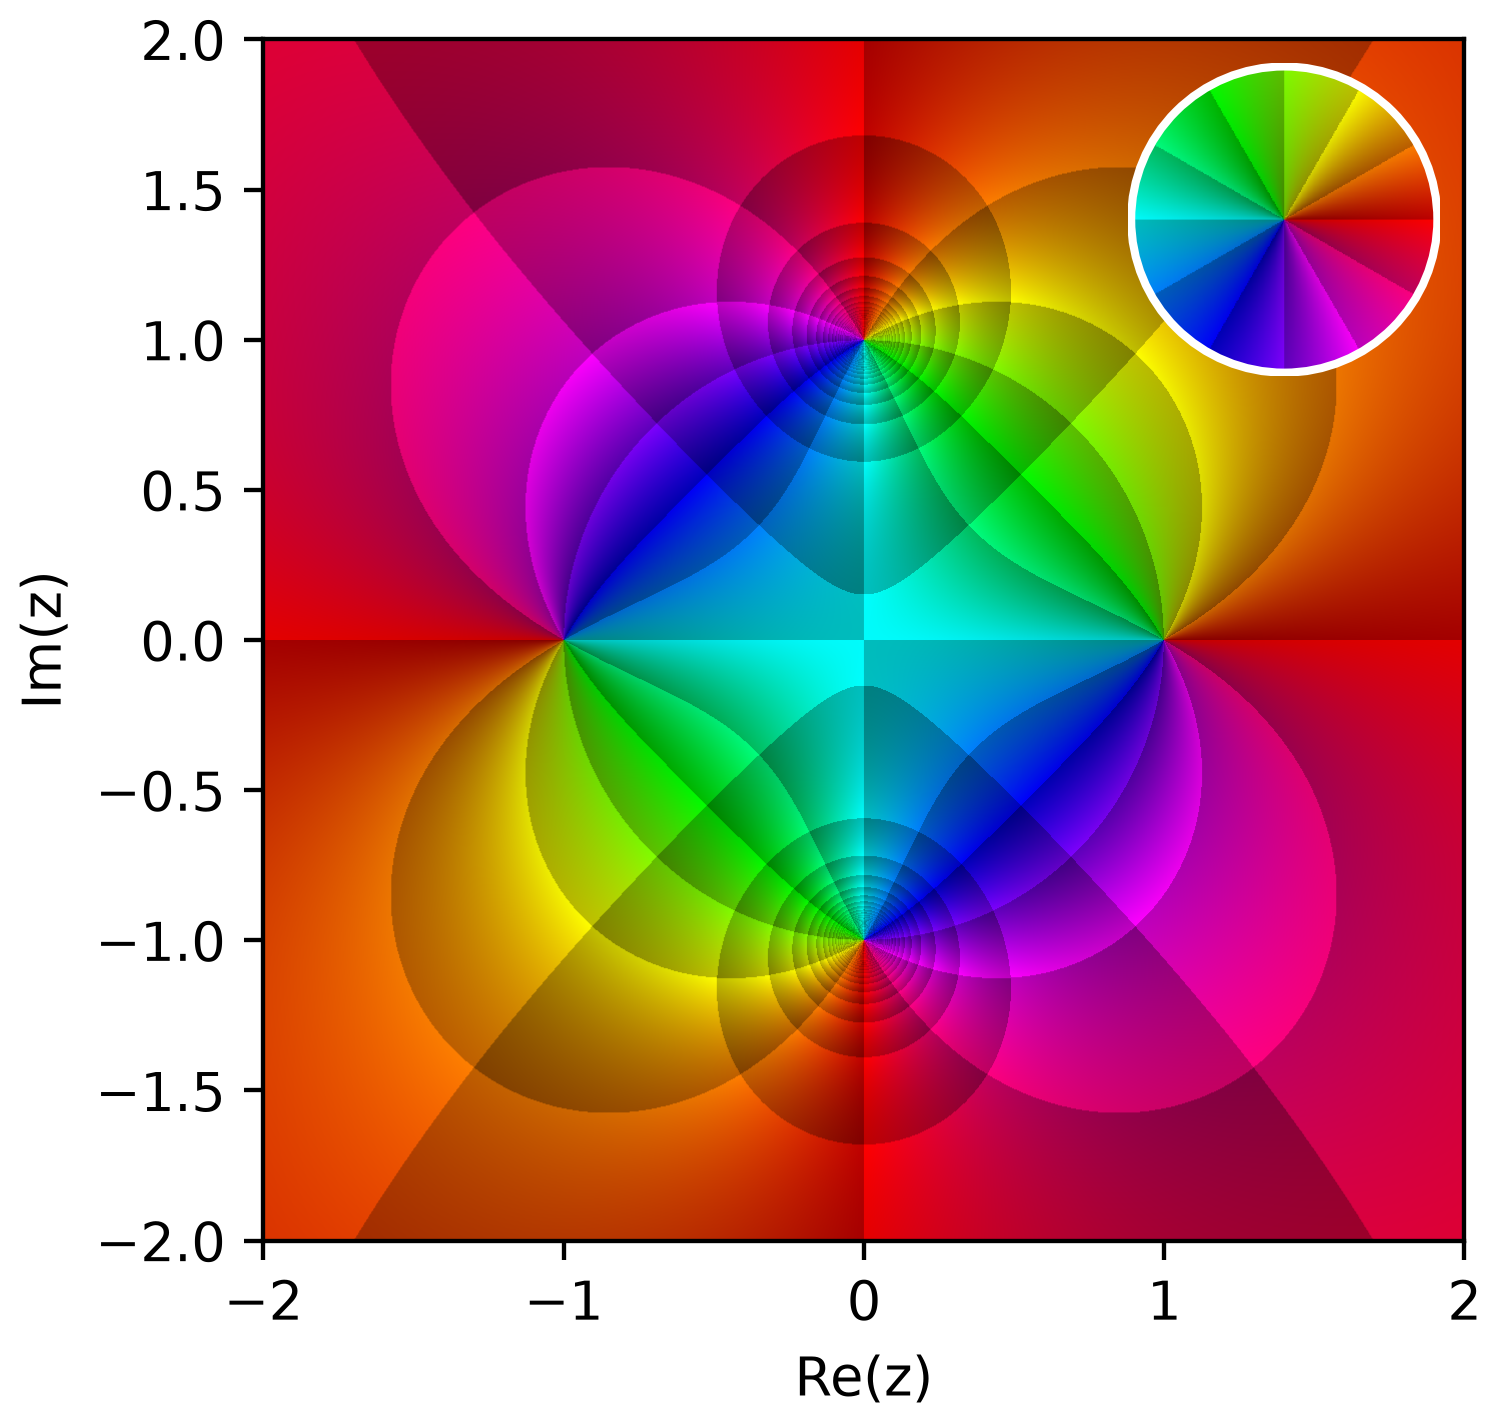
Pass legend=True to any 2D portrait and you get the inset above: the same colormap applied to
f(z) = z. Because the identity map sends each point to itself, the inset is a picture of the
colour convention itself — which hue means which phase, and how wide a modulus band is. Read the
inset, then read the portrait.
Enhanced portraits: adding modulus
A plain phase portrait throws away |f(z)| entirely. An enhanced portrait puts some of it back
as shading, without disturbing the hue:
cp.Phase(phase_sectors=6)                      # phase sectors only
cp.Phase(phase_sectors=6, auto_scale_r=True)   # sectors + modulus bands, sized to match
cp.Phase(r_linear_step=0.5)                    # modulus bands only, every 0.5
The shaded cells are contour bands: each step in brightness is a fixed step in modulus. Crossing
bands quickly means the function is changing fast. auto_scale_r=True chooses the modulus step so
the cells come out roughly square, which is what makes them easy to count.
emphasize_unit_circle=True additionally marks |z| = 1, which is useful whenever the unit circle
is where the interesting behaviour lives.
Choosing a colormap
The default Phase uses full-saturation HSV, which is vivid and unambiguous about winding
direction. It is not the only option, and it is not always the best one.
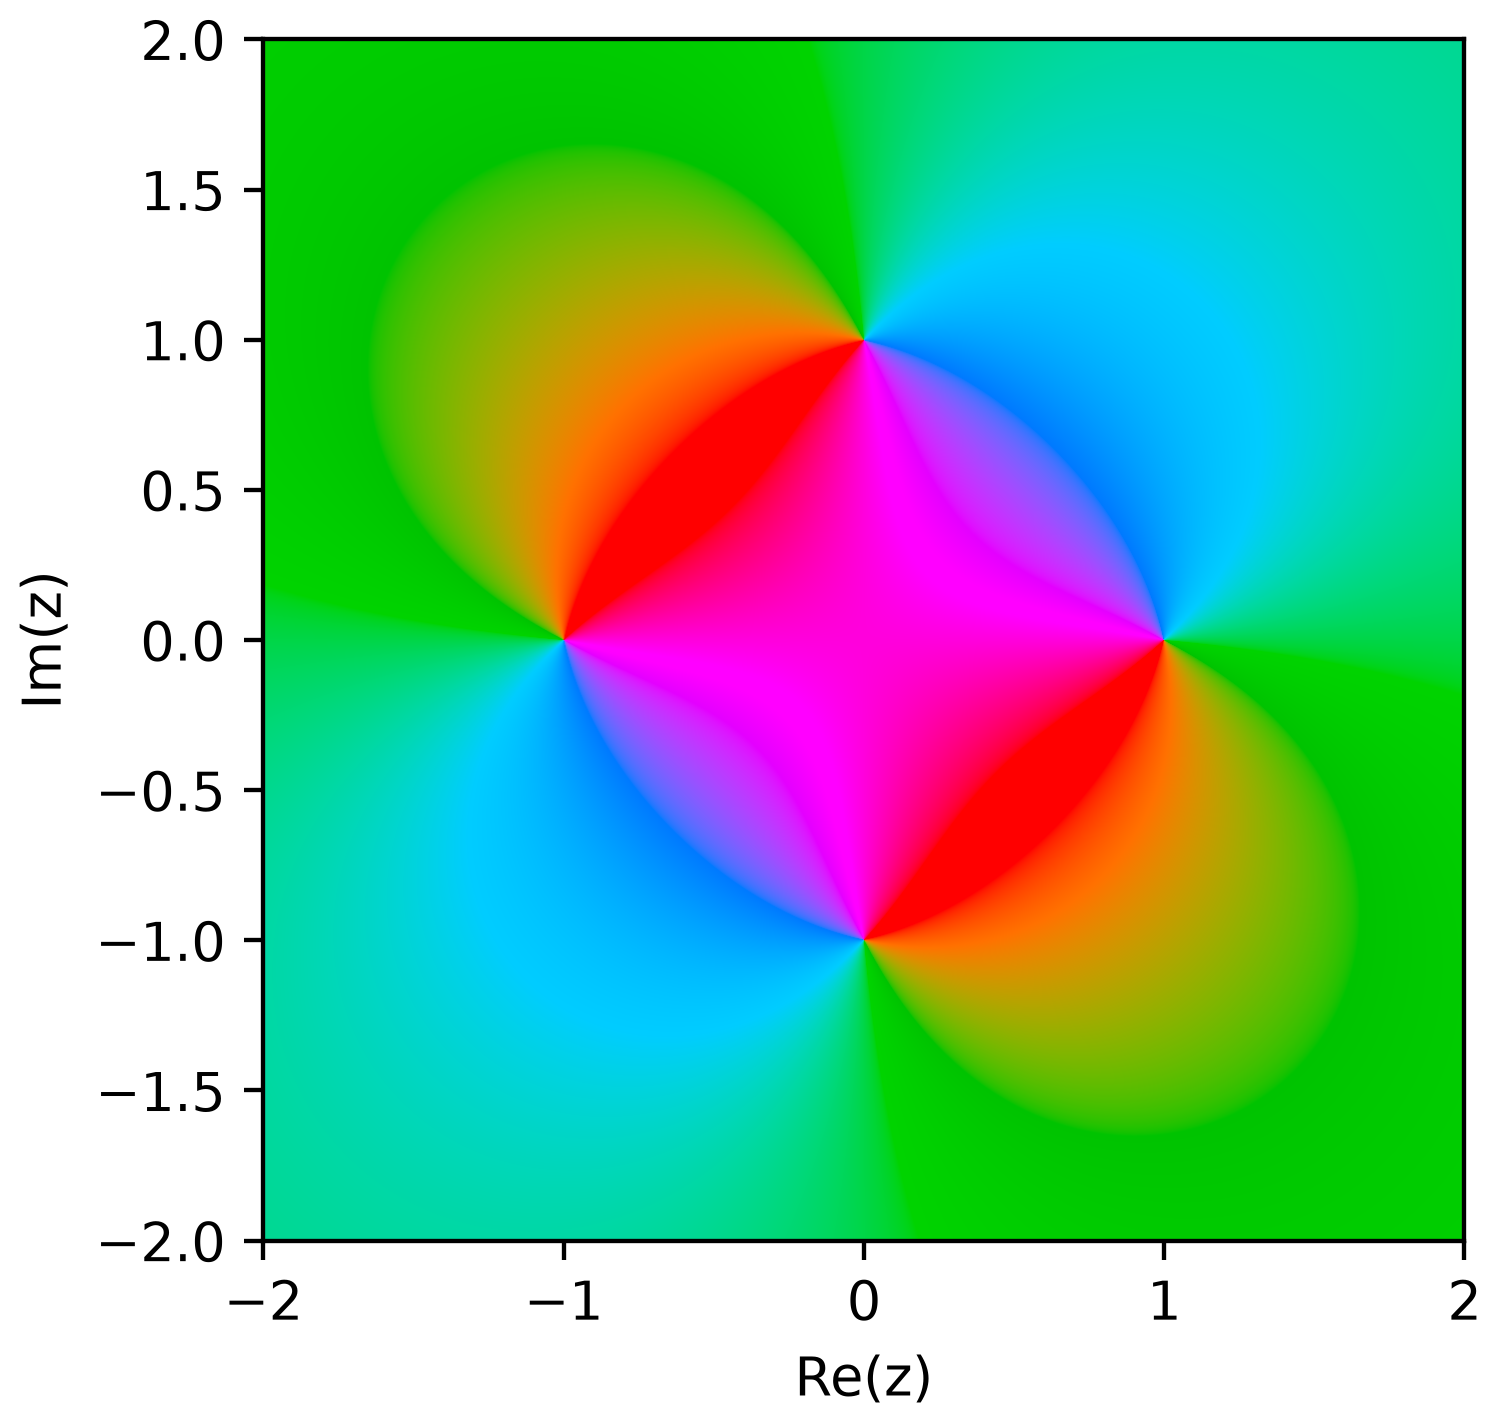
The families divide into two kinds, and the difference matters more than the appearance.
Decodable maps
These assign a distinct colour to every phase, so you can read the phase back out of the picture:
Phase, OklabPhase, PerceptualPastel, CubehelixPhase, Isoluminant, InkPaper,
FourQuadrant.
Maps that fold the phase circle
DivergingWarmCool and EarthTopographic run the phase through a single diverging axis, so
φ and π − φ come out the same colour. Twelve evenly spaced phases produce only seven
distinct colours in each. That is by construction, not a defect — they are built to emphasise
structure, and they do it well — but you cannot read a phase value off them, so reach for a
decodable map when the picture has to answer a question.
Measured, rather than asserted
The minimum perceptual separation between twelve evenly spaced phases, in CAM02-UCS units, where roughly 1 unit is a just-noticeable difference. "Deutan" is simulated deuteranomaly at full severity; "grey" is the luminance channel alone:
| Colormap | Normal | Deutan | Grey |
|---|---|---|---|
CubehelixPhase |
9.1 | 5.8 | 4.7 |
Isoluminant |
11.0 | 0.9 | 0.1 |
PerceptualPastel |
9.8 | 1.3 | 0.0 |
OklabPhase |
8.1 | 2.6 | 0.3 |
Phase (default) |
6.0 | 2.8 | 2.9 |
InkPaper |
5.5 | 0.8 | 0.0 |
AnalogousWedge |
2.5 | 2.4 | 0.2 |
FourQuadrant |
1.7 | 0.1 | 0.1 |
DivergingWarmCool |
0.0 | 0.0 | 0.0 |
EarthTopographic |
0.0 | 0.0 | 0.0 |
Read it like this:
CubehelixPhaseis the one to reach for when the audience is unknown. It is the only family that stays clearly readable under both colour-vision deficiency and greyscale printing.Isoluminantis the best in full colour and among the worst otherwise — it holds lightness constant deliberately, so removing colour removes everything. Use it when colour is guaranteed.- The default
Phaseis a reasonable middle. Full-saturation HSV loses a lot under deuteranomaly, but not everything, because its lightness varies with hue. - A 0.0 means two of the twelve phases are the same colour, which is the folding described above.
Whatever you pick, phase_sectors helps every reader: discrete bands can be counted even when two
adjacent colours are hard to tell apart.
color_and_accessibility.ipynb
runs this comparison interactively, simulating each family under the three common kinds of CVD.
Out-of-domain and non-finite values
Where the function is not defined, or returns a non-finite value, the colormap substitutes a fixed colour rather than producing a hole:
Every colormap guarantees finite RGB in [0, 1] for any input, including nan and inf, so a
singularity never produces an unrenderable pixel. This is why a pole can sit inside your domain
without special handling.
Next
- Domains and colormaps — choosing the region, and set arithmetic on it
- 3D landscapes and the Riemann sphere — putting the modulus back as height