Domains
A domain is the region of the complex plane you sample. Complexplorer treats it as a set you can do arithmetic on, which turns out to matter for more than tidiness.
The three primitives
import complexplorer as cp

cp.Rectangle(re_length=4, im_length=4)      # centred on the origin by default
cp.Disk(radius=2)
cp.Annulus(inner_radius=0.2, outer_radius=3)
Annulus is the one people reach for least and need most: it is how you draw 1/z without
sampling the pole itself.
Set arithmetic
Domains compose with | (union), & (intersection) and - (difference), producing a
CompositeDomain:
left = cp.Disk(radius=1.5, center=-0.75)
right = cp.Disk(radius=1.5, center=0.75)
hole = cp.Disk(radius=0.35)

peanut = (left | right) - hole
cp.plot(peanut, lambda z: 1 / z, cmap=cp.Phase(phase_sectors=6))
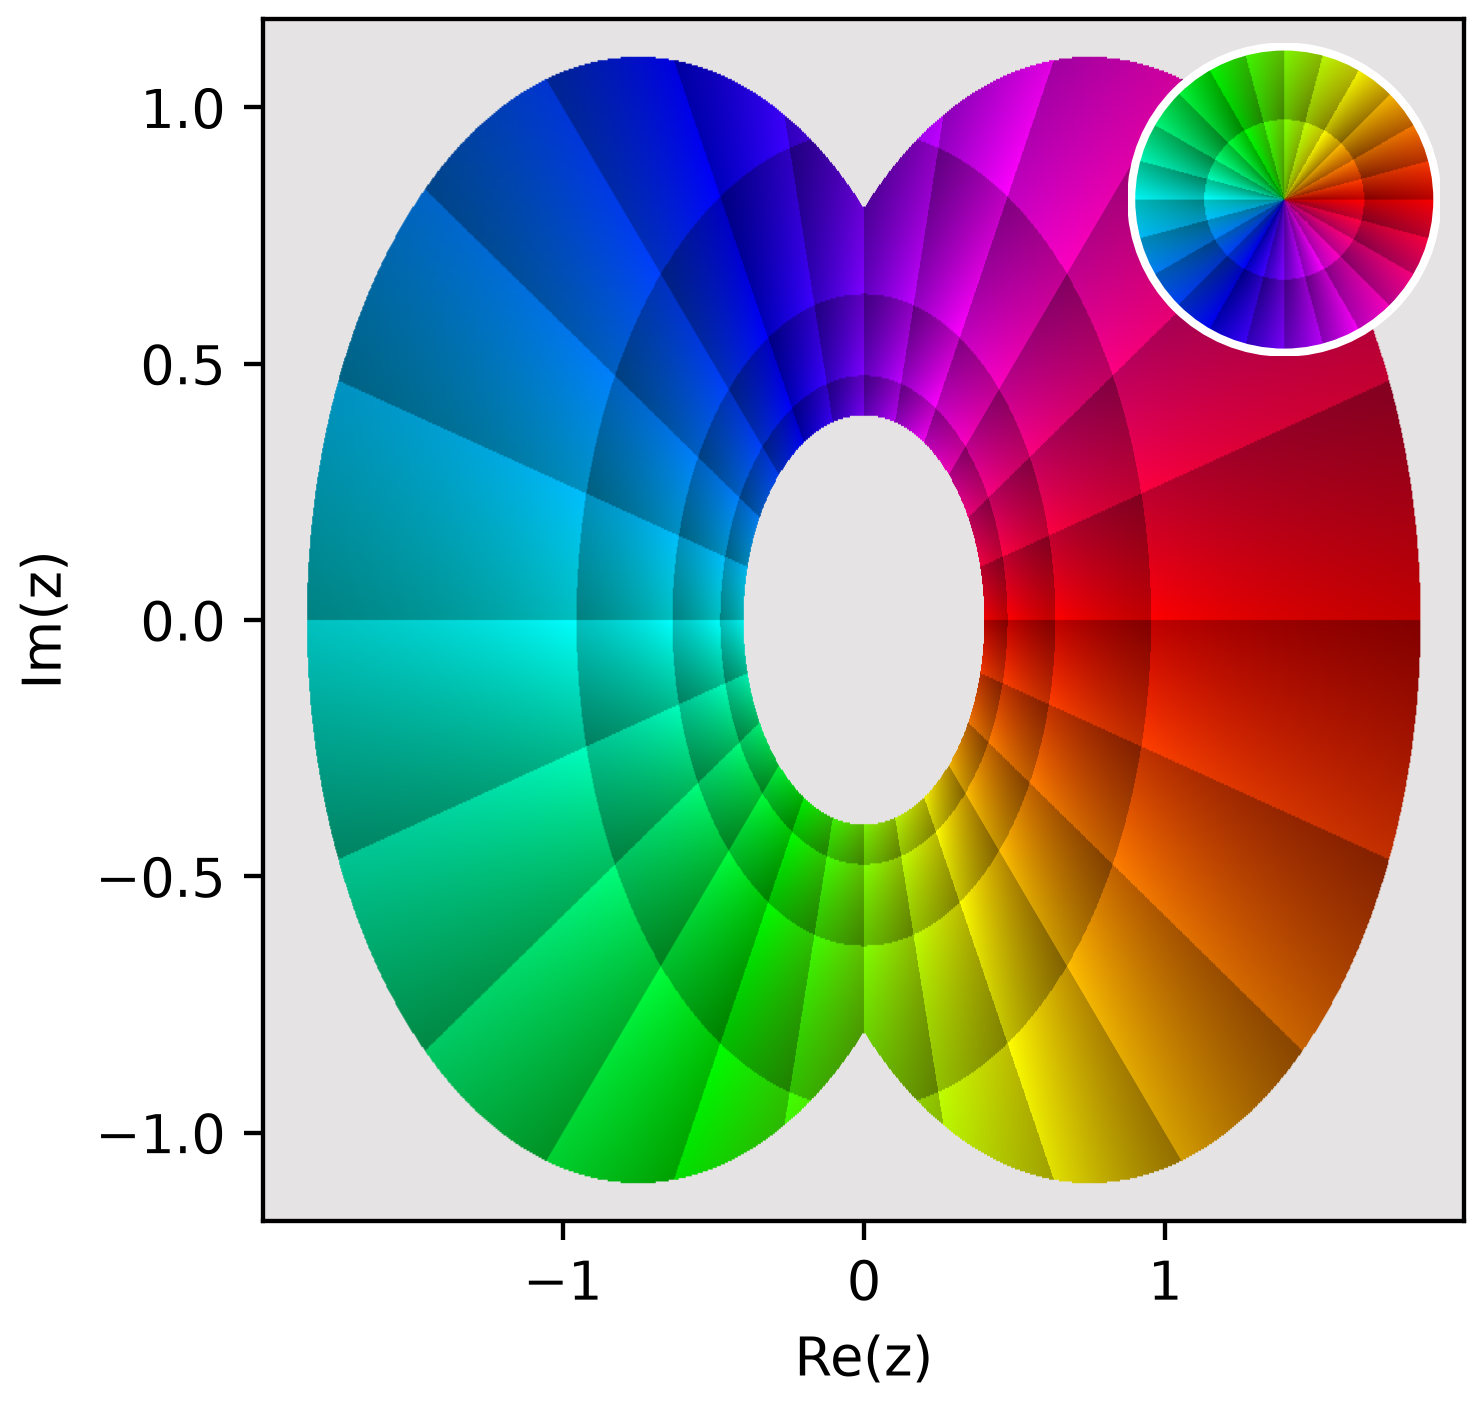
The outline is two overlapping disks unioned together, with a third punched out of the middle.
Excluding a neighbourhood of the pole is not cosmetic: it keeps the huge values near z = 0 out of
the sampling entirely.
That is the practical reason to care. A pole inside the sampled region drags the modulus scale with it, so every contour band elsewhere is compressed into invisibility. Cutting the pole out restores the rest of the picture.
Membership is inclusive at the boundary: a point exactly on the rim of a Disk is inside it.
Resolution
resolution is samples per axis, defaulting to 400:
Cost grows with the square, and so does the detail near a singularity, where the function changes fastest. If a portrait looks noisy around a pole, that is usually undersampling rather than a colormap problem.
Colormaps
Colormaps are covered in reading a phase portrait, including a measured comparison of how each family survives colour-vision deficiency and greyscale. The short version:
cp.Phase(phase_sectors=6, auto_scale_r=True)   # the default workhorse
cp.CubehelixPhase(phase_sectors=6)             # best when the audience is unknown
cp.Chessboard(spacing=0.5)                     # shows the mapping, not the phase
The greyscale pattern maps — Chessboard, PolarChessboard, LogRings — answer a different
question from the phase maps. They show what the function does to the plane: where a conformal
map preserves right angles, where a branch cut tears the grid, where a pole compresses it.
Next
- 3D landscapes and the Riemann sphere
- The gallery, which renders every colormap on the same function